A new market high in an unfinished emergency
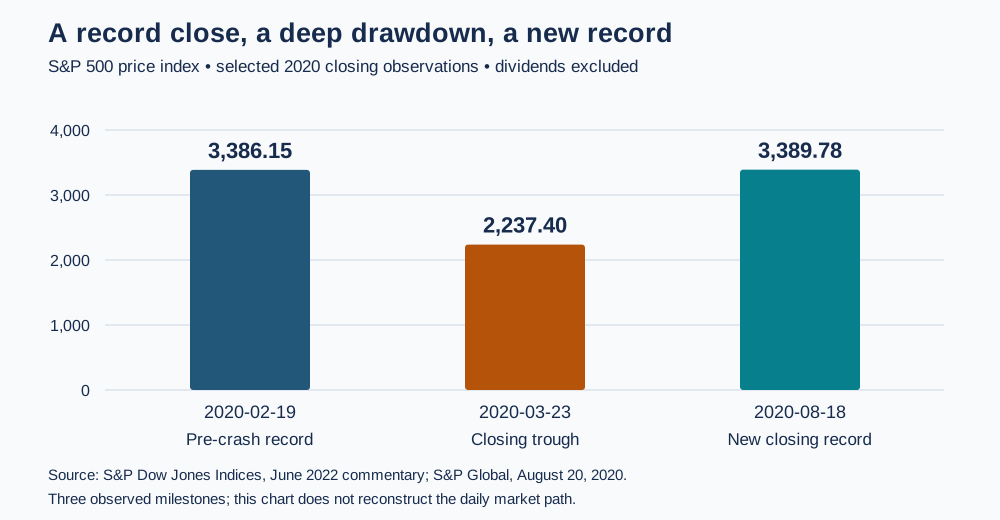
The COVID crash compressed a financial panic into weeks. The S&P 500 price index closed at 3,386.15 on February 19, 2020, sank to 2,237.40 on March 23, and reached a new closing high of 3,389.78 on August 18. The decline was 33.92%; the rebound from the trough was 51.51%. Those percentages are asymmetric because the recovery starts from a smaller base. They describe closing index prices, excluding dividends, rather than the experience of every investor or business. [1]
The central puzzle is why that recovery could coexist with enormous economic damage. A stock index values expected future cash flows of its constituent companies. Payrolls measure current employment; GDP measures production over a period. During 2020 those objects diverged sharply. Emergency policy reduced financing risks, investors reconsidered the duration of the shutdown, and large listed companies had very different exposures from the small, face-to-face businesses bearing much of the disruption. None of that makes a rising index a complete account of social welfare.
What “record rebound” measures
Here, “record” means the S&P 500 returned to a record closing level. It does not assert that every market recovered, or establish a fastest-ever recovery across all historical definitions. S&P Global contemporaneously described the February-to-March decline as its shortest bear market, using peak-to-trough duration. That differs from the time required to fall 20%, rise 20% from a low, or regain the old peak. A 20% bounce after a one-third decline still leaves an index below its starting value. [2]
Counting elapsed time after the initial close through the final close, February 19 to March 23 spans 33 calendar days and 23 trading sessions. March 23 to August 18 spans 148 calendar days and 103 sessions. The complete peak-to-recovery interval is 181 calendar days and 126 sessions. Session counts exclude weekends and the NYSE holidays April 10, May 25 and July 3. Total-return series, intraday records and different benchmarks require separate calculations; none is substituted here. [1][3]
Scroll horizontally to see all columns.
| S&P 500 price-index milestone | Close | Elapsed from prior row |
|---|---|---|
| February 19, 2020: pre-crash record | 3,386.15 | Starting observation |
| March 23, 2020: closing trough | 2,237.40 | 33 calendar days / 23 sessions |
| August 18, 2020: new closing record | 3,389.78 | 148 calendar days / 103 sessions |
When a health shock became a cash-flow shock
The abrupt interruption of travel, services and ordinary commerce made future revenues exceptionally hard to estimate. A business could enter the crisis with a viable model yet face immediate rent, payroll and debt payments without receipts. Creditors then had to distinguish a temporary funding gap from a permanent impairment. With the duration unknown, that distinction became unstable: the longer the interruption, the more likely a problem would become insolvency.
The equity selloff was therefore more than a mechanical response to weak quarterly earnings. Investors were repricing both expected profits and the range of possible failures. The Federal Reserve’s June report described a collapse in activity and unusually severe labor-market damage. In that setting, selling assets to obtain cash could be rational for each institution while collectively making market functioning worse. The analytical distinction is between losses caused by deteriorating economic prospects and additional losses caused by a market unable to intermediate urgent trades. [14]
The Treasury-market surprise
U.S. Treasury securities are central collateral and a benchmark for other borrowing costs. Their credit standing does not guarantee that large positions can always be sold immediately at stable prices. New York Fed analysis published in May described a sharp deterioration in during March, including wider bid-ask spreads and greater price impact. Dealers absorbed sales but faced swollen inventories, balance-sheet constraints and internal risk limits. This was a breakdown in trading capacity, not evidence that Treasury securities had become ordinary corporate credit risk. [6]
The pressure came from several directions. Lorie Logan’s July 2020 account described portfolio rebalancing, deleveraging and foreign official selling, alongside distortions in relative-value pricing. A cash-futures basis trade, for example, pairs a Treasury holding with a futures hedge; leverage and margin needs can turn a small pricing dislocation into forced sales. It would be too simple to assign the episode to hedge funds alone. The contemporaneous account identified broad demand for cash meeting constrained intermediation. [7]
Later New York Fed research in 2022 formalized a mechanism in which exceptional liquidity needs and limited dealer capacity can make safe-asset markets fragile. That is a subsequent model-based interpretation, not information investors possessed in March 2020 and not proof of the exact contribution of each seller. The distinction matters: a useful explanation can be consistent with events without uniquely identifying their cause. [16]
A sequence of interventions, not one switch
On March 15 the Federal Reserve reduced the federal funds target range to 0–0.25% and announced purchases of at least $500 billion of Treasuries and $200 billion of agency mortgage-backed securities. Its stated aims included smooth market functioning and the transmission of monetary policy. Lower overnight rates and securities purchases were related but distinct instruments: a policy-rate cut alone cannot absorb forced selling in a malfunctioning market. [4]
On March 23 the purchase commitment became amounts needed to support functioning rather than the previously specified minimum quantities. The Fed also announced corporate credit facilities and the Term Asset-Backed Securities Loan Facility, alongside other measures. Corporate facilities addressed financing for eligible companies; TALF supported markets financing consumer and business credit through securitization. They were not purchases of common stocks. Treasury backing and statutory eligibility conditions mattered to the structure. [5]
On April 9 the Fed announced measures intended to provide up to $2.3 trillion in loans, including Main Street lending, municipal and support for Paycheck Protection Program lending. That was announced capacity, not $2.3 trillion already spent or lent. Some facilities took time to open. A credible backstop can affect private pricing before substantial transactions occur, while limited use alone cannot establish either complete success or irrelevance. [8]
Fiscal support addressed a different hole
The CARES Act became law on March 27. Its programs included assistance for households and businesses, with Treasury helping implement the response. Transfers and forgivable small-business lending addressed lost income and operating expenses in ways ordinary central-bank loans could not. Monetary policy could keep credit channels operating; it could not by itself replace every interrupted wage or make an unprofitable borrower able to repay. [9]
The scale needs careful labeling. CBO’s preliminary April estimate put the CARES Act’s addition to federal deficits at about $1.7 trillion over 2020–2030. That budget score differs from headline assistance totals above $2 trillion, which include financial assistance whose budget cost is not necessarily its face amount. Nor should the fiscal score be added casually to announced Fed lending capacity as though both were comparable cash expenditures. Different instruments transfer different risks, on different timelines. [10]
The chronology that made the divergence visible
The sequence below pairs dated announcements with economic releases. Release dates are not the periods being measured: April employment was reported in May, and second-quarter GDP in July. The March stock-market low thus preceded the most dramatic published readings of the shutdown, without implying investors had correctly forecast every subsequent development.
Scroll horizontally to see all columns.
| Date in 2020 | Event or release | Interpretive limit |
|---|---|---|
| March 15 | Fed lowers target range to 0–0.25%; announces asset purchases [4] | Announcement, not immediate completion |
| March 23 | S&P 500 trough; Fed expands support [1][5] | Same-day timing does not prove exclusive causation |
| March 27 | CARES Act enacted [9][10] | Authorized assistance differs from disbursement |
| May 8 | BLS reports April payroll loss of 20.5 million [11] | Contemporary estimate, subsequently revisable |
| June 10 | Nasdaq Composite first closes above 10,000 [15] | Different index and milestone from S&P 500 |
| July 30 | BEA reports Q2 GDP contraction at 32.9% annualized [12] | Not a 32.9% quarter-on-quarter fall |
| August 18 | S&P 500 exceeds February closing record [1][2] | Price recovery does not measure employment recovery |
| September 4 | BLS reports August unemployment at 8.4% [13] | Data unavailable on August 18 |
Output and jobs had not returned to normal
In its May 8 release, BLS estimated that nonfarm payrolls fell 20.5 million in April and unemployment reached 14.7%. Leisure and hospitality bore the largest employment decline. BLS also flagged unusual classification problems: some people absent because of pandemic closures were recorded as employed rather than unemployed on temporary layoff. The reported unemployment rate therefore needed context even before later revisions. These are the figures released at the time, not a claim to use today’s revised historical series. [11]
BEA’s July 30 advance estimate reported a 32.9% annualized contraction in real GDP during the second quarter. Annualization asks what a quarterly pace would imply if repeated for a full year. Reversing that convention gives roughly a 9.5% quarter-on-quarter decline: (1 − 0.329) raised to one-fourth, minus one. It was a catastrophic quarterly fall, but not the disappearance of one-third of output in three months. [12]
The September 4 employment release later showed August unemployment at 8.4% and payroll employment 11.5 million below February. Those figures help evaluate the recovery retrospectively; they were not available on the August 18 record date. The June Fed report also documented disproportionate early job losses among lower-income workers. A rebound concentrated in asset values could therefore coexist with acute insecurity among households most exposed to lost work. [13][14]
Why the index could move faster than the economy
Three mechanisms plausibly reinforced one another. First, the perceived risk of a financing collapse diminished as public backstops expanded. Avoiding destructive refinancing failures can improve the value of equity even before sales recover. Second, lower discount rates can raise the present value of future earnings, particularly earnings expected far ahead. Third, investors could revise the expected duration of the disruption without concluding that current conditions were good. These are valuation mechanisms, not a numerical attribution of the rebound to policy.
Composition is equally important. Market-capitalization weighting gives larger companies more influence; the S&P 500 is not an employment-weighted sample of the U.S. economy. S&P Global’s August 20 comparison reported consumer discretionary and technology above their February 19 levels, while energy and financials were still substantially below. Nasdaq’s June 10 announcement of the Composite’s first close above 10,000 illustrates a different benchmark reaching a different milestone earlier. “The market recovered” conceals these differences. [2][15]
A higher valuation can reflect both improved expected earnings and a lower required return. Conversely, a market may overestimate either. The observed price alone cannot tell us how much investors assigned to vaccines, reopening, fiscal transfers, digital demand, interest rates or reduced disaster risk. A persuasive history should retain that uncertainty rather than turn a coincident policy announcement and market bottom into a single-cause experiment.
What the episode establishes
The strongest conclusion is a distinction among three recoveries: functioning markets, recovering asset prices and repaired household or business finances. They interact, but they are not interchangeable. Restoring Treasury helps pricing and financing throughout the system. Stabilizing credit can keep otherwise viable enterprises alive. Neither result guarantees an equal rebound across workers, industries or regions.
The COVID episode also exposes a measurement trap. A rapid climb from a depressed base sounds larger than the preceding fall; an annualized GDP rate sounds like a quarterly loss; lending capacity sounds like spending; and a record index sounds like a fully restored economy. Correct definitions remove those illusions without diminishing the scale of the shock. The historical achievement was a return to record equity prices amid extraordinary intervention and adaptation. The unfinished part was the much wider economic repair.
Sources
- S&P Dow Jones Indices, U.S. Equities Market Attributes, June 2022 (retrospective index levels)SourceBack to text: ↑1↑2↑3↑4↑5
- S&P Global, Daily Update, August 20, 2020 (contemporary record and sector comparison)SourceBack to text: ↑1↑2↑3↑4
- NYSE Group, 2020–2022 holiday calendar, December 23, 2019SourceBack to text: ↑
- Federal Reserve, March 15, 2020 FOMC statementOfficial releaseBack to text: ↑1↑2
- Federal Reserve, March 23, 2020 emergency measuresOfficial releaseBack to text: ↑1↑2
- New York Fed, Michael Fleming, Treasury market liquidity, May 29, 2020Official sourceBack to text: ↑
- New York Fed, Lorie Logan, Market Functioning Purchases, July 15, 2020Official sourceBack to text: ↑
- Federal Reserve, April 9, 2020 lending announcementOfficial releaseBack to text: ↑
- Treasury, About the CARES Act (retrospective program overview)Official sourceBack to text: ↑1↑2
- CBO, preliminary CARES Act budget estimate, April 16, 2020Official sourceBack to text: ↑1↑2
- BLS, April 2020 Employment Situation, released May 8, 2020Official releaseBack to text: ↑1↑2
- BEA, second-quarter 2020 GDP advance estimate, July 30, 2020Official sourceBack to text: ↑1↑2
- BLS, August 2020 Employment Situation, released September 4, 2020Official releaseBack to text: ↑1↑2
- Federal Reserve, June 2020 Monetary Policy Report, Part 1Official sourceBack to text: ↑1↑2
- Nasdaq MarketInsite, Composite closes above 10,000, June 10, 2020SourceBack to text: ↑1↑2
- New York Fed, How Can Safe Asset Markets Be Fragile?, September 8, 2022 (later research interpretation)Official sourceBack to text: ↑