A history of changing monetary systems
American interest-rate history is often pictured as a mountain: rising toward the early 1980s, descending for decades, reaching near zero after financial crises, then climbing sharply after the pandemic. That picture describes an important part of the postwar record. It misses the changes in institutions, inflation and financial contracts that made an identical quoted rate mean different things in different decades.
There has never been one interest rate for the entire United States. An overnight interbank transaction, a ten-year government obligation and a thirty-year mortgage price different promises. The Federal Reserve influences all three, but directly targets only a particular short-term market rate. This history therefore follows monetary regimes first, then uses two consistently labeled monthly series to illustrate the post-1954 record. The historical account and current policy endpoint were checked October 4, 2026.
The rates are related, but they are not interchangeable
The federal funds target range is a policy decision. The effective federal funds rate is an observed overnight market rate; its monthly average can differ from the target in force on the final day of the month. The discount rate applies to borrowing from a Federal Reserve Bank, with different discount-window programs and eligibility. It is not the same transaction as borrowing federal funds from another market participant. [7][23][24]
The ten-year Treasury constant-maturity yield is a market-based benchmark derived from the Treasury , not the interest expense on all federal debt. Mortgage rates also incorporate financing, credit, servicing and borrower-prepayment considerations. Freddie Mac’s weekly mortgage measure is a particular market average, not a quote available to every household; its methodology changed in November 2022. [8][26]
A nominal rate states interest in dollars. A real rate adjusts for purchasing power. Subtracting expected inflation from a nominal rate gives a useful approximation to the expected real rate; subtracting subsequently realized inflation answers a different, backward-looking question. A hypothetical 5% nominal rate with 2% inflation is roughly 3% real. With 7% inflation it is roughly minus 2%. Those examples explain why a high nominal rate does not by itself prove tight monetary conditions. [25]
Before 1913: money markets without a modern central bank
Before the Fed, financial stress could produce acute local shortages of currency and . The Panic of 1907 exposed the limits of private arrangements: trust companies were central to the panic, while assistance depended heavily on financiers and clearinghouse institutions. Its aftermath strengthened the case for a more elastic currency and a public institution able to support the banking system. [1]
President Woodrow Wilson signed the Federal Reserve Act on December 23, 1913. The resulting system balanced regional Reserve Banks with national oversight. Its original setting was a gold-based monetary order and a banking system very different from today’s. Early discount rates and money-market quotations are historically useful, but they cannot simply be attached to a modern federal funds chart and labeled one continuous policy rate. [2]
The Depression: low quoted rates did not guarantee easy credit
The Fed tightened in 1928–29 partly to restrain securities speculation. Banking panics and international gold-standard pressures then magnified the contraction. Federal Reserve History identifies both harmful policy actions and failures to provide sufficient lender-of-last-resort support. Fragmented decision-making and competing monetary doctrines impeded the response. [3]
Deflation made the arithmetic especially damaging. Falling prices raised the real burden of debts fixed in dollars, even where nominal rates looked low. Bank failures and credit rationing also restricted access to borrowing. The relevant financial condition was therefore broader than the yield on a safe security. A borrower unable to refinance did not experience the same economy as an investor holding a liquid government obligation. This distinction helps explain why a low-rate chart alone is a poor account of the Depression. [3][25]
World War II and the 1951 break with pegged Treasury yields
In April 1942, the Fed committed to a three-eighths-percent Treasury-bill peg and implicitly capped long-term Treasury bond yields at 2.5% to support wartime financing. Defending those prices meant buying securities when necessary, compromising control over its balance sheet and money creation. These were administered constraints on government yields, not a modern federal funds target. [4]
After the war, inflation and Treasury financing objectives came into conflict. The Treasury-Federal Reserve Accord, announced March 4, 1951, separated monetary policy from the obligation to maintain wartime debt prices. Implementation involved a transition rather than an instantaneous free-market reset. Its lasting importance was institutional: monetary policy gained greater room to respond to economic conditions even when that made government borrowing more expensive. Independence remained an operating arrangement within a congressionally created system, not freedom from public accountability. [4]
Bretton Woods, inflation and the limits of stop-go policy
The postwar international system linked currencies to the dollar and official dollar convertibility to gold. Growing external dollar claims and domestic policy tensions strained that arrangement. President Richard Nixon suspended official dollar-gold conversion in 1971; efforts to rebuild fixed exchange rates subsequently failed. The United States entered a different monetary regime, in which credibility increasingly depended on policy institutions rather than convertibility. [5]
The Great Inflation had already begun in the mid-1960s. Fiscal pressures, energy shocks, mistaken estimates of productive capacity and a willingness to accommodate inflation interacted. The 1973 and 1979 oil shocks mattered, but they are not a complete explanation for persistent inflation. Repeated easing when employment weakened made it harder to establish confidence that price stability would endure. The relative contribution of these forces remains a subject of economic research. [5]
Volcker: a policy change, volatile rates and a costly disinflation
On October 6, 1979, Paul Volcker’s Fed shifted operating emphasis toward restraining reserves and monetary growth, accepting wider variation in overnight rates. The episode was not a neat sequence of today’s quarter-point target announcements. Rates rose, fell and rose again as policy, inflation and activity interacted. Tight conditions imposed severe costs on housing, dealers, farms and other interest-sensitive borrowers. [6]
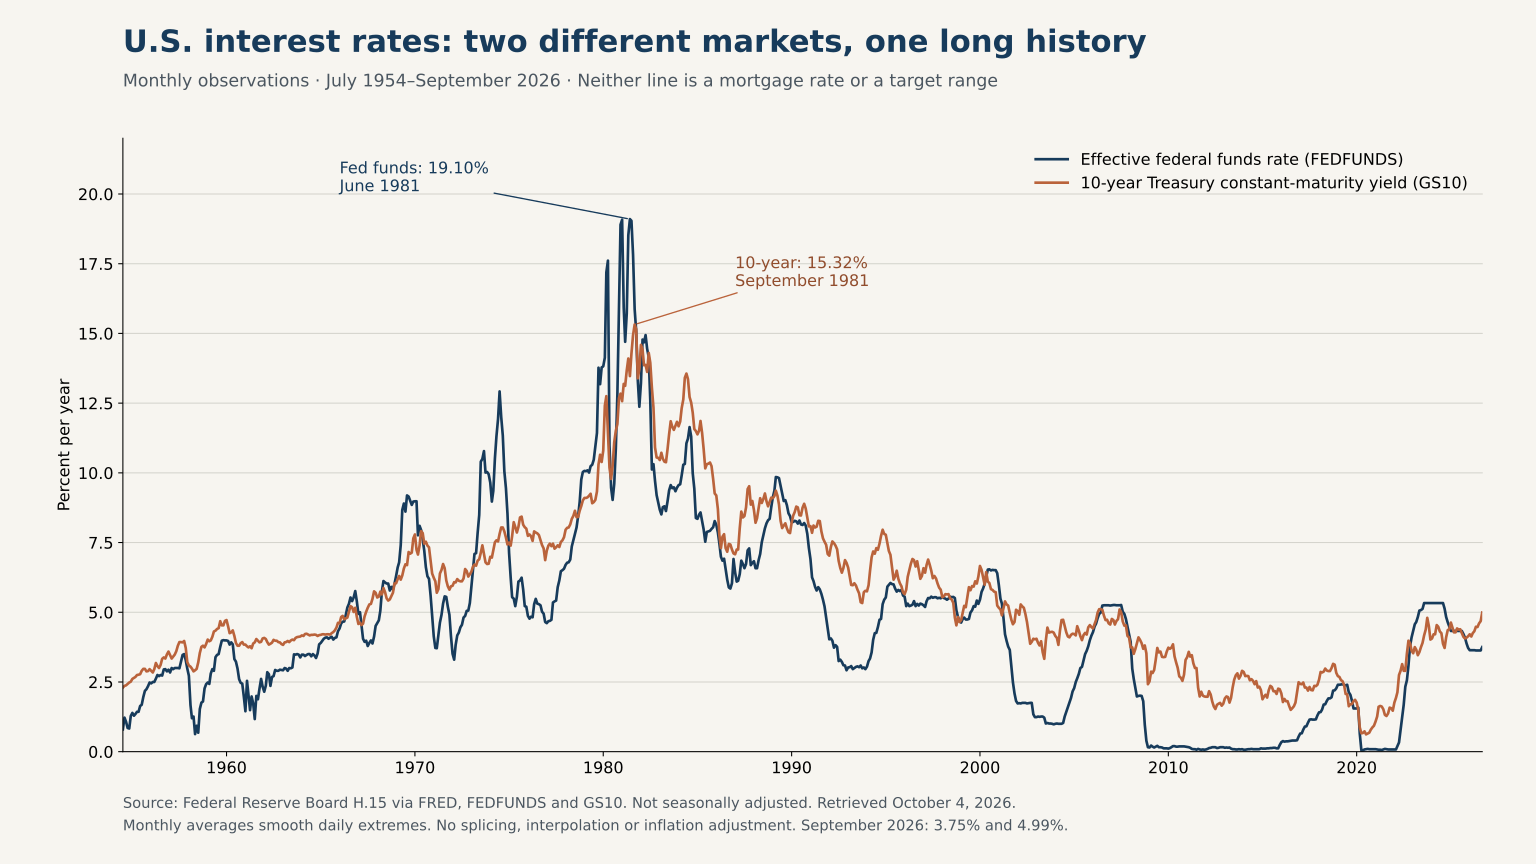
The comparable monthly data give the peak precisely: the effective federal funds rate averaged 19.10% in June 1981, while the ten-year constant-maturity Treasury yield reached its monthly peak of 15.32% in September 1981. Neither is a mortgage rate or the highest intraday quote. Monthly averaging smooths shorter-lived extremes. The difference between the two peaks also illustrates why maturity and measurement frequency matter. [7][8]
Disinflation came with a deep 1981–82 recession and unemployment reaching 10.8% in late 1982. The experience strengthened the view that sustained price stability required credible commitments, even when maintaining them was politically painful. It does not establish a mechanical rule that every future inflation episode requires an identical recession or identical nominal rate. Starting conditions, expectations and the source of inflation differ. [6]
The long descent was neither smooth nor exclusively American
From the mid-1980s to 2007, inflation and output became less volatile in what economists called the Great Moderation. Explanations include better monetary policy, structural changes and the nature of the shocks hitting the economy; there is no single settled allocation of credit. Policy communication also changed. In February 1994, the FOMC began publicly announcing policy changes, reducing the need for markets to infer decisions from trading operations. [9]
Lower inflation helped reduce nominal yields, but global saving and investment also mattered. Ben Bernanke’s 2005 saving-glut argument emphasized international capital flows and demand for assets. Later Fed discussion also highlighted demographic and productivity influences on real rates. These explanations are complementary hypotheses rather than proof that any one variable controls bond yields. A secular decline can coexist with substantial tightening cycles and temporary bond-market losses. [11][27]
2001 and the financial crisis: the policy rate reaches its floor
In December 2001, after the downturn and September 11 disruptions, the FOMC lowered its funds target to 1.75%, citing persistent weakness in demand. The subsequent housing-credit expansion cannot be attributed to that rate alone. Underwriting, securitization, leverage, global financing and expectations about house prices also affected the buildup. Federal Reserve History explicitly records disagreement over the size of monetary policy’s contribution to the housing boom. [10][12]
Mortgage losses and funding-market stress spread in 2007–08. On December 16, 2008, the FOMC established a 0%–0.25% target range as economic activity weakened and credit conditions remained strained. A near-zero overnight rate could not by itself restore damaged intermediary balance sheets or eliminate risk premiums. facilities and other interventions addressed disruptions that conventional rate cuts could not fully resolve. [12][13]
Large-scale purchases of Treasury and agency securities, commonly called quantitative easing, sought to ease longer-term financing conditions. Forward guidance influenced expectations about future policy. These tools mattered because long yields reflect an expected path of short rates plus compensation for holding longer-duration risk, among other influences. QE changed the public’s mix of assets; it was not a promise that mortgage rates would equal zero or that every additional dollar of reserves would become a new loan. [12][14][23]
The 2010s: low rates and a new operating framework
The December 2015 increase to a 0.25%–0.50% target range marked the first departure from the post-crisis floor. The FOMC emphasized improved labor conditions while inflation still ran below its longer-run objective, and retained reinvestment of its substantial securities holdings. The historical lesson is that increasing an overnight policy rate and shrinking a central-bank balance sheet are separate decisions. [15]
Before the financial crisis, the Fed usually managed scarce reserves to keep market rates near its target. In the ample-reserves framework, administered rates, especially interest on reserve balances, do much of that work. A large reserve supply can coexist with positive or high policy rates. Consequently, comparing balance-sheet size across decades without explaining the implementation regime can confuse the plumbing of monetary policy with its intended economic stance. [23]
The pandemic and the 2022–23 inflation response
On March 15, 2020, the FOMC returned the target range to 0%–0.25% as the pandemic disrupted economic activity. It announced additional securities purchases and emphasized functioning credit markets. This was a health-related shutdown and market- shock, not a replay of the mortgage-loss mechanism of 2008. The policy instruments overlapped, but the underlying disruptions differed. [16]
Inflation later broadened amid pandemic-related supply and demand imbalances and energy pressures. The BLS reported a 9.1% twelve-month increase in headline CPI for June 2022, before seasonal adjustment. That is a CPI observation, not the Fed’s preferred PCE inflation measure and not a monthly annualized rate. On March 16, 2022, the Fed began lifting its target range to 0.25%–0.50%; by July 26, 2023 it reached 5.25%–5.50%. [17][18][19]
The tightening illustrates the distinction between a stock and a flow of debt. New loans and floating-rate balances can reprice quickly; existing fixed-rate obligations often do not until refinancing or maturity. The composition and timing of debt therefore shape transmission. A rise in market yields can immediately reduce a bond’s resale value even while its promised coupon remains unchanged. These contractual differences help explain why the same policy move affects borrowers and asset holders unevenly.
The verified endpoint: easing, then a 2026 increase
On September 18, 2024, the Fed cut the target range by half a percentage point to 4.75%–5.00%, citing progress on inflation and a changed balance of risks. By December 10, 2025, the range was 3.50%–3.75%. Then, on September 16, 2026, it increased by a quarter point to 3.75%–4.00%. The September statement described solid activity and elevated inflation. These are dated policy decisions, not a forecast that tightening will continue. [20][21][22]
Balance-sheet policy also changed: runoff that began in June 2022 ended starting December 1, 2025. The December 2025 statement described purchases of shorter-term Treasuries as needed to maintain ample reserves. Such reserve-management purchases should not automatically be described as a new macroeconomic QE program. The purpose and composition of transactions matter alongside their size. [21][28]
The broader historical conclusion is that there is no timeless normal U.S. interest rate. Inflation expectations, productivity, global saving, fiscal financing, risk appetite and policy credibility interact. Historical averages describe their sample, not a guaranteed destination. Understanding which rate is being quoted, the monetary regime behind it and the contracts through which it reaches the economy is more informative than comparing today’s number with a remembered peak.
Reading the long-run chart
The figure shows separate monthly series for the effective federal funds rate and ten-year Treasury constant-maturity yield from July 1954 through September 2026. Both are percentages per year, not seasonally adjusted, and use published monthly observations. The lines are never spliced. September 2026 averages were 3.75% and 4.99%, respectively; the funds average differs from the 3.75%–4.00% target range because it summarizes transactions over a month containing a policy change. [7][8]
The chart does not reconstruct a nineteenth-century policy rate, include mortgage rates, adjust for inflation or measure bond total returns. Its common starting date is the beginning of the modern monthly FEDFUNDS series, not the beginning of American money markets. Earlier regimes are presented in the historical timeline so that institutional differences remain visible.
Timeline: institutions, decisions and measured peaks
Policy ranges below are announced FOMC targets. Chart peaks are monthly observed market rates; wartime pegs apply to Treasury securities.
Scroll horizontally to see all columns.
| Date or period | Milestone | Rate or distinction |
|---|---|---|
| 1907 | Banking panic strengthens reform movement [1] | No modern FOMC target |
| December 23, 1913 | Federal Reserve Act signed [2] | New central-bank system |
| 1929–33 | Contraction, bank failures and deflation [3] | Nominal yields alone understate financial stress |
| April 1942 | Wartime yield support [4] | Bills 0.375%; long bonds implicitly capped at 2.5% |
| March 4, 1951 | Treasury-Fed Accord announced [4] | Debt-price support no longer determines monetary policy |
| 1971–73 | Dollar-gold conversion suspended; fixed-rate system unravels [5] | Change in international monetary regime |
| October 6, 1979 | Reserve-focused operating approach announced [6] | Greater overnight-rate volatility |
| June / September 1981 | Peaks in the two monthly chart series [7][8] | FEDFUNDS 19.10% / GS10 15.32% |
| December 16, 2008 | Funds target reaches effective floor [13] | 0%–0.25% |
| December 16, 2015 | Post-crisis liftoff [15] | 0.25%–0.50% |
| March 15, 2020 | Pandemic emergency easing [16] | 0%–0.25% |
| March 16, 2022 | Tightening cycle begins [18] | 0.25%–0.50% |
| July 26, 2023 | Target reaches cycle high [19] | 5.25%–5.50% |
| September 18, 2024 | Half-point reduction [20] | 4.75%–5.00% |
| December 10, 2025 | Further easing [21] | 3.50%–3.75% |
| September 16, 2026 | Quarter-point increase [22] | 3.75%–4.00% |
Sources
- Federal Reserve History, The Panic of 1907; checked October 4, 2026SourceBack to text: ↑1↑2
- Federal Reserve History, Federal Reserve Act Signed into Law; checked October 4, 2026SourceBack to text: ↑1↑2
- Federal Reserve History, The Great Depression; checked October 4, 2026SourceBack to text: ↑1↑2↑3
- Federal Reserve History, The Treasury-Fed Accord; checked October 4, 2026SourceBack to text: ↑1↑2↑3↑4
- Federal Reserve History, The Great Inflation; checked October 4, 2026SourceBack to text: ↑1↑2↑3
- Federal Reserve History, Volcker’s Announcement of Anti-Inflation Measures; checked October 4, 2026SourceBack to text: ↑1↑2↑3↑4
- Federal Reserve Board via FRED, FEDFUNDS; monthly percent, not seasonally adjusted; checked October 4, 2026SourceBack to text: ↑1↑2↑3↑4
- Federal Reserve Board via FRED, GS10; monthly percent, not seasonally adjusted; checked October 4, 2026SourceBack to text: ↑1↑2↑3↑4
- Federal Reserve History, The Great Moderation; checked October 4, 2026SourceBack to text: ↑
- Federal Reserve, December 11, 2001 FOMC statement; checked October 4, 2026Official releaseBack to text: ↑
- Federal Reserve, Bernanke: The Global Saving Glut, March 10, 2005; checked October 4, 2026Official sourceBack to text: ↑
- Federal Reserve History, The Great Recession and Its Aftermath; checked October 4, 2026SourceBack to text: ↑1↑2↑3
- Federal Reserve, December 16, 2008 FOMC statement; checked October 4, 2026Official releaseBack to text: ↑1↑2
- Federal Reserve, Open Market Operations; checked October 4, 2026Official sourceBack to text: ↑
- Federal Reserve, December 16, 2015 FOMC statement; checked October 4, 2026Official releaseBack to text: ↑1↑2
- Federal Reserve, March 15, 2020 FOMC statement; checked October 4, 2026Official releaseBack to text: ↑1↑2
- BLS, June 2022 CPI release, July 13, 2022; checked October 4, 2026Official releaseBack to text: ↑
- Federal Reserve, March 16, 2022 FOMC statement; checked October 4, 2026Official releaseBack to text: ↑1↑2
- Federal Reserve, July 26, 2023 FOMC statement; checked October 4, 2026Official releaseBack to text: ↑1↑2
- Federal Reserve, September 18, 2024 FOMC statement; checked October 4, 2026Official releaseBack to text: ↑1↑2
- Federal Reserve, December 10, 2025 FOMC statement; checked October 4, 2026Official releaseBack to text: ↑1↑2↑3
- Federal Reserve, September 16, 2026 FOMC statement; checked October 4, 2026Official releaseBack to text: ↑1↑2
- Federal Reserve, Interest on Reserve Balances FAQs; checked October 4, 2026Official sourceBack to text: ↑1↑2↑3
- Federal Reserve, Discount Window; checked October 4, 2026Official sourceBack to text: ↑
- St. Louis Fed, Getting Real about Interest Rates; checked October 4, 2026SourceBack to text: ↑1↑2
- Freddie Mac via FRED, MORTGAGE30US; weekly mortgage rate and methodology note; checked October 4, 2026SourceBack to text: ↑
- Federal Reserve, Fischer: The Low Level of Global Real Interest Rates, July 31, 2017; checked October 4, 2026Official sourceBack to text: ↑
- Federal Reserve, Policy Normalization; checked October 4, 2026Official sourceBack to text: ↑