A safe promise with a dangerous price
The 30-year Treasury bond massacre was a collapse in the market value of distant, fixed-dollar payments. The central episode ran from the pandemic’s exceptionally low yields in 2020 through the inflation and interest-rate reset culminating in autumn 2023. It did not require the Treasury to miss a payment. Investors could receive every promised coupon while the price someone else would pay for their bonds fell dramatically.
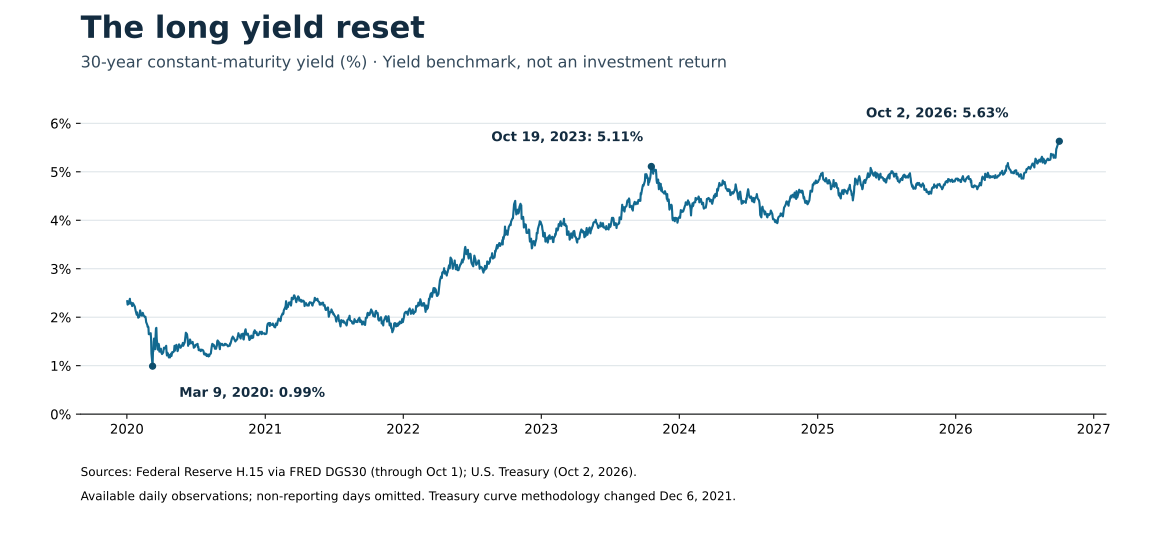
The scale becomes clear in the government’s constant-maturity benchmark: the 30-year yield was 0.99% on March 9, 2020, reached 5.11% on October 19, 2023, and fell to 4.03% on December 29, 2023. That late-year rally did not end the story. Treasury’s October 2, 2026 observation was 5.63%, above the October 2023 level. These are dated yield observations, not the return of an investable security. The distinction is essential to understanding both the losses and the incomplete recovery. [1][2]
Scroll horizontally to see all columns.
| Observation date | 30-year yield | Measurement |
|---|---|---|
| March 9, 2020 | 0.99% | Constant-maturity benchmark |
| October 19, 2023 | 5.11% | Constant-maturity benchmark |
| December 29, 2023 | 4.03% | Constant-maturity benchmark |
| October 2, 2026 | 5.63% | Constant-maturity benchmark |
Three different things called the long bond
An individual 30-year Treasury bond has a particular coupon, maturity date and purchase price. It ages: a bond bought with thirty years remaining in 2020 has roughly twenty-four years remaining in 2026. Treasury bonds pay fixed interest every six months. Their redemption value does not rise simply because prevailing interest rates do. [3]
The 30-year constant-maturity Treasury yield instead describes a point on an estimated par . Treasury derives that curve from indicative bid-side market quotations. The benchmark continues to represent thirty years as time passes; it is neither a transaction price nor the yield history of one unchanging bond. A chart of this rate cannot be inverted into an exact investor return without specifying cash flows and a pricing method. [2]
The iShares 20+ Year Treasury Bond ETF, TLT, supplies a third lens: a tradable portfolio of Treasury bonds with more than twenty years remaining in its benchmark. It distributes income and maintains long-duration exposure as its holdings change. It has fund expenses, a net asset value and a separate exchange-traded price. Calling its performance “the return on the 30-year Treasury” erases meaningful differences. Here it is a long-Treasury proxy, never a substitute for a specific bond. [4]
The starting point made the fall so severe
At a yield near 1%, most of the value of a low-coupon thirty-year bond rests in principal that will not arrive for decades. Very little coupon income cushions a sudden repricing. The market was effectively paying a high price for a long sequence of comparatively small payments, followed by a distant principal repayment.
Pandemic policy reinforced the low-rate environment. On March 15, 2020, the Federal Reserve set a federal funds target range of 0%–0.25%; it also announced large Treasury and agency mortgage-backed securities purchases to support market functioning. Those actions did not mechanically determine every long-bond quote. They nevertheless marked an extraordinary policy setting in which depressed near-term rates and demand for safe assets could coexist with acute trading stress. [5][6]
The March yield low should not be confused with a universally verified price peak across all long-bond instruments. Coupons, accrued interest, and the date of a particular security’s issuance matter. The benchmark identifies the extraordinary starting yield; this article does not claim a measured peak-to-trough return for every thirty-year bond.
Duration turned a rate reset into a capital loss
A bond’s price is the present value of its remaining coupons and principal. When investors require a higher yield, those unchanged dollars are discounted more heavily. Duration summarizes the first-order sensitivity: a modified duration of twenty means that a one-percentage-point yield increase implies approximately a 20% price decline for a sufficiently small, parallel move, before convexity.
That approximation becomes unreliable over a four-percentage-point shock. Plain fixed-rate bonds have positive convexity: their price–yield relationship bends. As yields rise and prices fall, their duration generally decreases, so extending the initial duration linearly exaggerates the loss. Convexity moderates the decline relative to that straight-line estimate; it does not prevent a very large decline.
Lower coupons and longer maturities concentrate value farther into the future, increasing exposure to discount-rate changes. A newly purchased high-coupon bond and an old low-coupon bond can therefore respond differently to the same market shock. “Government guaranteed” describes a payment promise. It does not describe the volatility of the price before maturity.
An explicit numerical reconstruction, not a historical bond quote
Consider an invented $100-face-value bond issued and settled March 9, 2020, maturing March 9, 2050. Its annual coupon is 1%, paid as $0.50 each March 9 and September 9, starting September 9, 2020. For illustration, discount all remaining cash flows using each selected date’s 30-year benchmark yield, quoted as an annual rate compounded semiannually. Between coupons, use the actual number of days remaining divided by the actual days in that coupon period; subtract accrued interest to obtain the clean price.
The calculated initial price is $100.26 at 0.99%. At a 5.11% discount yield on October 19, 2023, the clean price is $40.81. Adding accrued interest and the $3.50 of coupons already received produces $44.42 of wealth if coupons were held as cash earning nothing: a 55.70% loss against the original outlay. The clean-price decline alone is 59.30%. These are different measurements.
The example is deliberately hypothetical. The coupon schedule is invented, the discount curve is assumed flat, and a thirty-year par yield is used as a scenario rate even as the bond ages. It is not a traded CUSIP, an executable dealer quote, or evidence that every thirty-year Treasury lost 59%. The calculation isolates how very low coupons and a large yield reset can destroy market value without changing promised payments.
Scroll horizontally to see all columns.
| Scenario valuation date | Clean price per $100 face | Wealth including cash coupons |
|---|---|---|
| March 9, 2020 | $100.26 | $100.26 |
| October 19, 2023 | $40.81 | $44.42 |
| December 29, 2023 | $51.25 | $55.06 |
| October 2, 2026 | $40.15 | $46.71 |
Inflation changed the policy regime
The rate environment that supported 2020 valuations did not persist. The Bureau of Labor Statistics reported a 9.1% increase in headline consumer prices over the twelve months ending June 2022. By the July 2023 meeting, the Federal Reserve’s target range had reached 5.25%–5.50%. Those are different measures: observed consumer inflation and an overnight policy-rate target, respectively. Neither is itself a thirty-year discount rate. [7][8]
Still, their connection to bond valuation is powerful. Unexpected inflation reduces the purchasing power of fixed nominal payments. A central bank’s response can raise expected future short-term interest rates, increasing the return investors demand on longer securities. If markets also conclude that rates will remain elevated longer, a bond can decline even after the pace of tightening slows.
The inflation surprise and the monetary response are therefore connected explanations, not cleanly separable rivals. Nor does a fall in the current inflation rate automatically restore old bond prices. Prices reflect the expected path of future rates and compensation for uncertainty, rather than only the latest inflation reading.
Real yields and term premiums complicate the story
A nominal yield can be examined through real yields and inflation compensation. But the gap between nominal Treasuries and inflation-protected securities is not a pure forecast of inflation: inflation risk compensation and differences in also matter. A higher nominal yield does not, by itself, establish that long-run inflation expectations have become unanchored.
In November 2023, New York Fed official Roberto Perli described the recent rise in Treasury yields as driven mainly by real rates. He also distinguished changing policy expectations from term premiums, the extra compensation investors may demand for taking long-horizon interest-rate risk. The components are estimated rather than directly observable, and different methods can produce different levels. [9]
A September 2024 Federal Reserve staff study of the second half of 2023 attributed much of the ten-year yield increase to rising term premiums, with quantitative tightening, issuance and uncertainty among the contributors. It also warned that survey-based estimates could overstate that contribution because expectations adjusted slowly. Its ten-year findings help explain the market environment; they are not a precise decomposition of the thirty-year move. [10]
More duration for private investors to absorb
The Federal Reserve’s May 2022 runoff plan allowed Treasury holdings to decline, initially subject to a $30 billion monthly cap and then $60 billion after three months. A runoff cap is a limit on redemptions without reinvestment, not a promise to sell that amount of bonds into the market. Nonetheless, reduced reinvestment shifts more financing onto other investors than would otherwise be required. [11]
Treasury issuance matters through both the amount of borrowing and its maturity composition. Longer issuance places more interest-rate exposure in private hands. The price needed to clear that supply depends on pension, insurance, overseas, bank, fund and household demand, as well as dealer capacity. A larger supply need not produce a fixed number of of additional yield.
Treasury’s borrowing advisory committee in October 2023 identified a combination of strong economic activity, possible changes in neutral rates, supply-demand dynamics and term premiums. That multi-factor explanation is more credible than assigning the entire selloff to one auction, one fiscal announcement or one investor group. Market prices reveal the outcome; they do not identify the separate causal contribution of every force. [12]
A rebound did not mean the old purchase price returned
The fall in the thirty-year benchmark from 5.11% in October to 4.03% at the end of 2023 supported a substantial price rebound. In the same hypothetical bond calculation, the December 29 clean price rises to $51.25. That is a 25.59% rebound from $40.81, yet it remains far below the initial $100.26. Percentage gains after a deep decline apply to a smaller base.
Actual fund returns tell a related but distinct story. iShares reports TLT NAV total returns of −4.76% for 2021, −31.41% for 2022 and +2.96% for 2023. The positive full-year 2023 figure does not mean there was no severe within-year drawdown. Annual returns also cannot establish the precise date or depth of a daily peak-to-trough loss. This article therefore does not manufacture a TLT maximum drawdown from those annual observations. [4]
Coupon income is part of the recovery arithmetic. Reinvesting it changes the eventual result, while spending it changes the investor’s remaining account value. Total-return series normally make a reinvestment assumption; an unadjusted price chart does not. Comparing the two without adjustment can substantially overstate the loss attributable to the investment experience.
The follow-through into October 2026
By October 2, 2026, Treasury’s thirty-year benchmark stood at 5.63%. The issuer reported TLT NAV of $77.42 and an exchange closing price of $77.48 that day; its displayed year-to-date NAV total return was −7.81% through October 1. The return date is a day earlier than the price date. Those observations show continued pressure on long-duration exposure, but do not by themselves supply a complete 2020-to-2026 reinvested return. [2][4]
The hypothetical bond’s clean value at the October 2 benchmark yield is $40.15. Its $6.50 in cumulative cash coupons, plus accrued interest and market value, brings wealth to $46.71, still 53.41% below the starting outlay. This remains a scenario calculation using the benchmark as a flat discount rate, not a backtest of an actual security.
A February 2026 Federal Reserve staff note offered a longer-run interpretation: rising far-forward real risk premiums could reflect perceived supply-shock and fiscal risks without a comparable increase in far-ahead inflation compensation. That is model-based analysis of far-forward rates, not proof that fiscal concerns caused every subsequent daily move or a direct estimate for the thirty-year bond. [13]
What survived the massacre
An investor who holds an individual bond to maturity still has its contractual nominal cash flows, assuming payment as promised. That does not erase the lost opportunity to earn a higher yield elsewhere, the effect of inflation, or the difficulty of needing before maturity. Buying above face value also means redemption at par does not restore the original purchase price by itself.
A rolling long-bond fund has no single maturity date at which the investor is guaranteed a specified principal repayment. Conversely, a pension or insurer comparing bonds with similarly long liabilities may experience a different economic outcome from someone judging asset prices alone: liability values can decline when discount rates rise too. The relevant exposure depends on both sides of the balance sheet.
The lasting lesson of 2020–2023, extended by the dated 2026 observations, is a distinction rather than a trading instruction. Credit quality, market liquidity, purchasing-power protection and price stability are separate properties. The long Treasury retained a promise of dollars far in the future. What collapsed was the present market price investors were willing to pay for that promise.
Sources
- Federal Reserve H.15 via FRED: daily 30-year constant-maturity yield historySourceBack to text: ↑
- U.S. Treasury: daily par yield curve rates, 2026 and methodologyOfficial sourceBack to text: ↑1↑2↑3
- TreasuryDirect: Treasury bonds and payment termsOfficial sourceBack to text: ↑
- iShares: TLT objective, NAV, price and calendar-year total returnsSourceBack to text: ↑1↑2↑3
- Federal Reserve: March 15, 2020 implementation noteOfficial releaseBack to text: ↑
- Federal Reserve: August 2020 balance-sheet developmentsOfficial sourceBack to text: ↑
- BLS: June 2022 consumer price index releaseOfficial releaseBack to text: ↑
- Federal Reserve: July 25–26, 2023 meeting minutesOfficial sourceBack to text: ↑
- New York Fed: Disentangling Messages from the Treasury Market, November 16, 2023Official sourceBack to text: ↑
- Federal Reserve staff: The Treasury Tantrum of 2023, September 3, 2024Official sourceBack to text: ↑
- Federal Reserve: May 4, 2022 balance-sheet reduction planOfficial releaseBack to text: ↑
- Treasury Borrowing Advisory Committee report, October 31, 2023Official releaseBack to text: ↑
- Federal Reserve staff: far-forward Treasury rates, February 12, 2026Official sourceBack to text: ↑