From an obscure tax provision to a central retirement institution
The rise of the 401(k) changed the financial contract between American employers and workers. A traditional defined-benefit pension promises a benefit determined by a formula. A defined-contribution plan builds an individual account whose eventual purchasing power depends on contributions, investment results, expenses and withdrawals. The 401(k) is a prominent form of defined-contribution plan, not a synonym for every retirement account. [2]
The transformation has two distinct dimensions: a much larger pool of invested retirement assets and a transfer of important retirement decisions and risks toward households. Neither proves that every worker gained access or accumulated enough to retire. This history therefore separates the tax rules, the growth of plans, actual participation and the distribution of balances.
The long-run statistical backbone is the Labor Department’s September 2025 historical bulletin, covering plan years through 2023. More recent observations are identified separately rather than spliced into a supposedly uniform series. The discussion concerns primarily private-sector employment; public pensions and Social Security remain separate parts of the retirement system. [1]
1978 and 1981: legislation opened the door; implementation made it usable
Congress added section 401(k) to the Internal Revenue Code in the Revenue Act of 1978. IRS regulatory clarification followed in 1981, giving employers a clearer framework for cash-or-deferred arrangements. An IRS-hosted historical study and the Congressional Research Service both identify this sequence. The statutory origin and the later operational expansion should not be collapsed into one “invention” date. [3, 4]
The essential arrangement let an employee choose to receive compensation in cash or defer it into a qualified plan. Traditional elective deferrals reduce current federal taxable income, with distributions generally taxable later. Employers may contribute, including through a match. Eligibility, vesting, contribution limits and nondiscrimination requirements affect how the arrangement works; a tax preference is not an unconditional subsidy for any account labeled retirement. [5]
This created a scalable payroll-based savings channel. An employee could accumulate an account through repeated deductions rather than negotiate an individual investment transaction each payday. A match could strengthen the incentive to participate, while the employer could define its contribution policy without promising a fixed future pension payment. That operating model helps explain adoption; it does not mean the 1978 law required employers to replace their pensions.
The pension shift was larger than the 401(k)
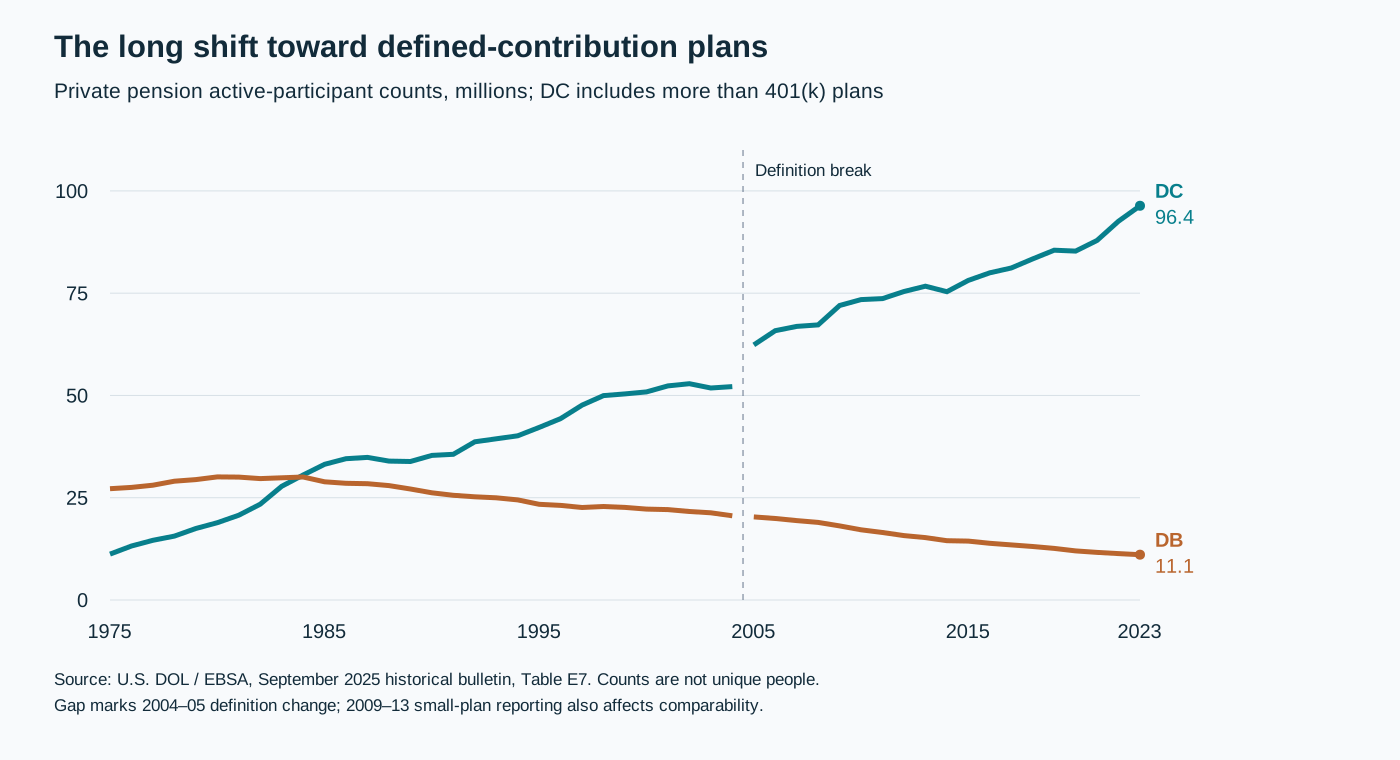
DOL records 27.2 million active-participant counts in private defined-benefit plans and 11.2 million in defined-contribution plans in 1975. By 2023 the corresponding counts were 11.1 million and 96.4 million. DC counts had already slightly exceeded DB counts in 1984. DC includes profit-sharing and other account-based plans, so that crossover cannot be described as the year 401(k)s alone overtook pensions. [1]
CRS identifies several reasons for the broader shift: employers generally find DC contributions more predictable, while DB obligations can require additional funding after investment losses. DB administration also involves actuarial estimates. Account portability can appeal to employees who change jobs, although portability is not the same as preserving every dollar through a transfer. The relative appeal of either model depends on tenure, plan design and the worker’s circumstances. [2]
Analysis: the time series establishes the direction of change, not a single cause. It cannot tell us how much came from an employer freezing a pension, a new firm choosing a DC plan, changing employment patterns or increased eligibility. Nor does a declining active DB population imply that all pension obligations disappeared: retirees and former employees may still be owed substantial benefits.
The asset story: scale, compounding and market reversals
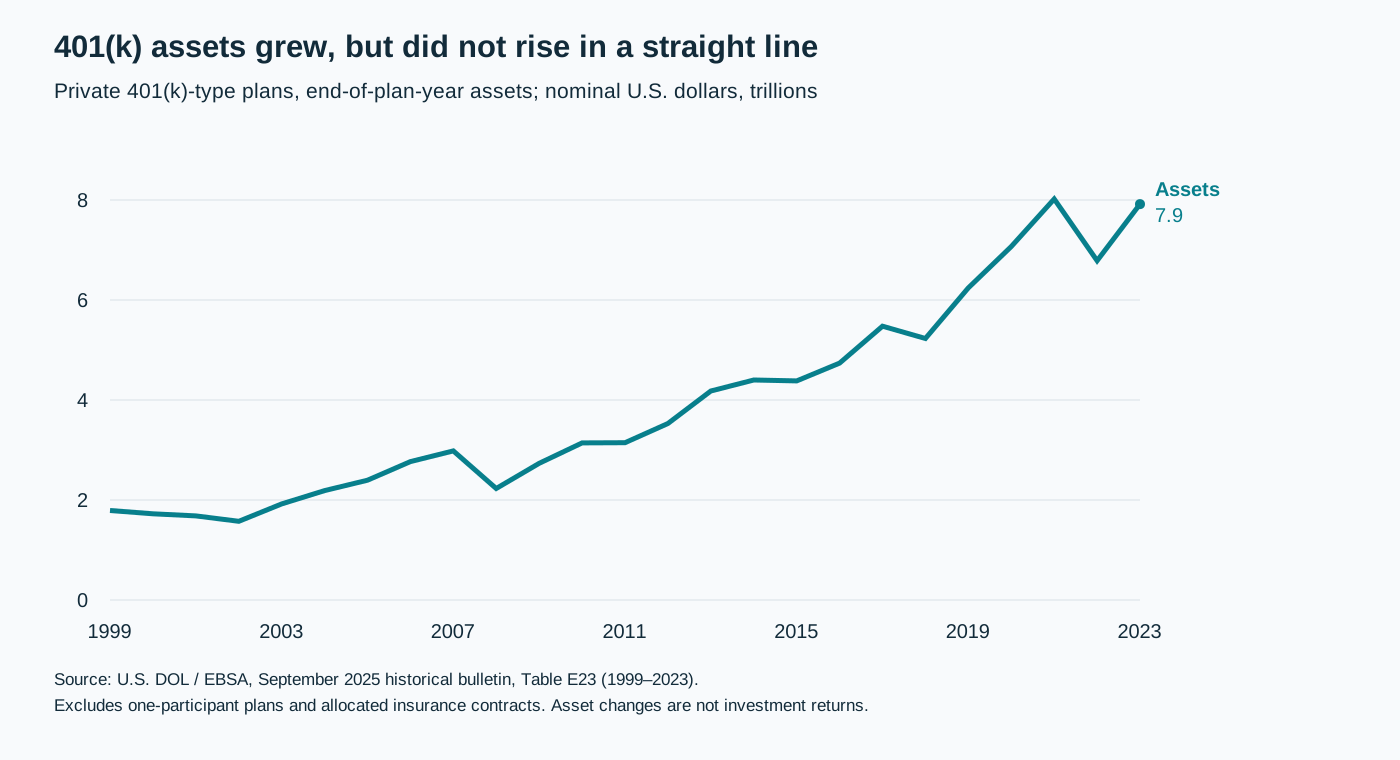
For an early benchmark, a 1998 Federal Reserve Bank of St. Louis article reported 17,303 401(k) plans with approximately $91.8 billion in assets in 1984. For the consistent chart below, DOL’s 1999–2023 series starts at $1.79 trillion and ends at $7.92 trillion. These are nominal dollars, unadjusted for inflation or population growth. [6, 1]
The latest point in that historical series covers 724,720 plans, about 105.2 million total participant counts and 81.6 million active-participant counts. These three numbers measure different things. A plan is an arrangement, a participant record is not necessarily a unique person, and active status does not necessarily mean current employee contributions. [1]
As a separately labeled industry benchmark, the Investment Company Institute’s 2025 Fact Book estimates $8.9 trillion in 401(k) assets at year-end 2024. ICI is a fund-industry trade association, and this observation is not appended to the DOL chart as though it were another row of the same source and . Assets held in IRAs are a separate category, even when they originated in an employer plan. [7]
Why an asset balance is not a savings flow or a return
In DOL’s series, 401(k) assets fell from $8.020 trillion in 2021 to $6.786 trillion in 2022, a calculated 15.4% decline, then rose to $7.918 trillion in 2023, a calculated 16.7% increase. Those changes do not equal the typical saver’s investment return. Contributions, benefits, transfers and changes in the reporting population also affect aggregate assets. [1]
Table E25 records $677.7 billion of employer and employee contributions in 2023 and $685.2 billion of benefits, using DOL’s specified definitions. Their difference is negative $7.4 billion. Yet assets increased by about $1.13 trillion that year. The arithmetic makes the distinction visible: a contribution-minus-benefit subtotal cannot explain the entire change in the asset stock. It is not a complete reconciliation or a measure of national net saving. [1]
A rollover illustrates another measurement trap. Moving an account from a workplace plan to an IRA can reduce reported workplace-plan assets without reducing the household’s retirement assets by the same amount. Conversely, a larger 401(k) balance does not establish that a household increased total saving: it may have shifted money from another account. The economic outcome requires a wider household balance sheet.
Coverage: count workers, then ask which denominator applies
Access means a worker can use a benefit; participation means the worker participates; take-up measures participation among those with access. In March 2026, BLS reported that 72% of private-industry workers had access to a retirement benefit and 52% participated. These figures cover DB or DC plans, not 401(k)s alone. BLS reported a 72% take-up rate, calculated from unrounded estimates. [8]
The employment divide was substantial: 81% of full-time private-industry workers had access, compared with 44% of part-time workers. Access was 48% in the lowest occupational-wage quartile and 92% in the highest. These wage categories classify occupations by average wage, not each individual’s household income. [8]
Analysis: automatic enrollment can improve take-up where a plan exists, but it cannot enroll an employee whose employer offers no plan or whose eligibility conditions are unmet. A larger number of plans also need not translate proportionately into broader coverage: many small plans and one very large plan carry very different worker weights. Use population-based survey measures for access questions rather than dividing plan counts by an employment estimate.
A necessary warning about the historical participation chart
DOL’s active-participant definition includes eligible employees who do not elect to contribute. For 2004 and earlier, the published counts were adjusted to exclude people who were not contributing and were not entitled to benefits. The bulletin provides a revised 2004 comparison: DC active counts rise from 52.158 million under the earlier treatment to 61.320 million under the revised definition. That roughly 9.2 million difference is a classification effect, not millions of new savers suddenly joining. [1]
There is another comparability qualification: from 2009 through 2013, DOL treated all participants reported on Form 5500-SF as active because those short forms reported only a total. Separate active reporting began in 2014. One-participant plans are excluded, estimates account for filers, and a person can appear in multiple plans. The chart shows a durable structural shift while deliberately declining to present the entire span as an unbroken count of unique contributing workers. [1]
Automatic enrollment changed the default, not the underlying need to save
IRS rulings in 1998 and 2000 clarified that automatic enrollment could apply to new hires and certain existing employees. The Pension Protection Act of 2006 further facilitated adoption. The practical change was behavioral: an eligible worker would begin contributing at a default rate unless choosing otherwise, with a default investment when no investment election was made. Workers retain the ability to opt out or change elections. [9]
CRS analysis of 2021 Form 5500 data found automatic enrollment in 16.5% of DC plans, with 37.1% of participants in plans that had the feature. The difference illustrates the importance of weighting: large plans were more likely to offer it. Being in such a plan also does not establish that a particular person entered through the default rather than enrolling voluntarily. Provider surveys can report different adoption rates because their client populations differ. [9]
Analysis: enrollment is the first step in a longer process. A low starting rate can become an anchor if workers never revisit it. Escalation can raise contributions but also reduce current take-home pay. Payroll accuracy, clear notices and usable opt-out controls are therefore part of the policy’s economics, not merely administrative details. Success should be measured through durable saving and retirement resources as well as the initial enrollment rate.
SECURE changed the rules for new plans and part-time access
SECURE 2.0 generally requires affected newly established 401(k) and 403(b) plans to use automatic enrollment for plan years beginning after 2024. The statutory design starts default contributions at 3%–10% of compensation and increases them by one percentage point annually until reaching a plan maximum of at least 10% and no more than 15%, subject to applicable rules. Employees can choose a different rate or opt out. [10]
Important exceptions include arrangements established before December 29, 2022, certain small and new businesses, SIMPLE 401(k)s, governmental plans and church plans. The January 2025 rulemaking cited here was a proposal explaining implementation of the enacted requirement; it is not presented as the enactment itself or as final regulations. The reform is consequently not a universal command that every existing employer automatically enroll every worker. [10]
The SECURE legislation also broadened the route into 401(k) elective deferrals for long-term part-time employees. IRS guidance explains that the three-consecutive-year condition of at least 500 hours per year was reduced to two consecutive years beginning in 2025. Age and other applicable eligibility rules still matter. That addresses a different barrier from automatic enrollment: whether the worker may enter the arrangement in the first place. [11]
Fees and investment risk became household outcomes
A visible account balance gives workers information and control, but it does not promise a particular retirement income. Market losses, inflation, contribution interruptions and the order of returns around retirement can all change what the account supports. Concentrating retirement assets in the employer’s stock can combine employment risk and investment risk. A target-date default simplifies allocation decisions without eliminating market risk or guaranteeing that withdrawals will last a lifetime. [2, 12]
DOL distinguishes investment, administrative and individual-service expenses and emphasizes the fiduciary responsibility to assess services and reasonable costs. Fees matter through compounding, including when they are less visible than a separately billed charge. Comparing only a fund expense ratio can omit recordkeeping or account-level costs. [12]
Original illustration, not a return forecast: take an unchanged $10,000 starting balance, no contributions or withdrawals, 30 years and a hypothetical 6% annual gross return. Modeling annual costs as a reduction in that return gives approximately $52,753 at a 0.3% cost and $43,219 at a 1.0% cost. The higher-cost outcome is about 18.1% lower. Actual returns fluctuate, fee methods differ, and service quality matters; the example isolates only the arithmetic of a persistent cost difference.
Bigger averages do not describe the typical family
The Federal Reserve’s 2022 Survey of Consumer Finances found that 54.3% of families held retirement accounts. Among those holders, the median balance was $86,900 and the mean $334,000, in 2022 dollars. This category includes IRAs, Keogh accounts and certain employer accounts such as 401(k)s and 403(b)s. It is neither a 401(k)-only statistic nor a balance for every family. [13]
The wide gap between mean and median signals why a headline average can obscure the experience of many households. Families without these accounts are excluded from both conditional balance measures. They may still have Social Security or DB benefits; the absence of an account is not equivalent to having no retirement resources. Age, earnings and the number of earners also make comparisons between family balances and single-plan participant averages misleading.
Analysis: contribution opportunities and capacity to use them are separate. An eligible employee with unstable hours or urgent household expenses may save less than a higher-paid employee offered the same menu and match. Tax-favored capacity at the top of the distribution does not, by itself, close access or gaps at the bottom. Evaluating the system requires the distribution of outcomes, not just aggregate dollars.
What the next stage needs to demonstrate
The first generation of the 401(k) system made payroll saving and portable individual accounts widely usable. The next generation is being judged on continuity: whether new workers get access, defaults produce lasting contributions, job changes preserve savings, fees remain proportionate to service and accumulated balances become dependable retirement income.
For employers and financial providers, that points toward a practical measurement set: eligible workers, actual contributors, contribution persistence, employer contributions received, all-in expenses and balances retained through job transitions. For public policy, it means separating expanded access from stronger take-up and separating either from retirement adequacy. Those are analytical measures to investigate, not a claim that any single provider has achieved them.
The central lesson is that the rise of the 401(k) is both a success in building a large savings institution and an unfinished effort to turn that scale into broad retirement security. Its history is most informative when the data preserve the differences between plans and people, assets and flows, and a tax-advantaged account and a lifetime income promise.
Sources
- U.S. DOL/EBSA, Private Pension Plan Bulletin Historical Tables and Graphs, 1975–2023; September 2025, Tables E7 and E23–E25Official source · PDFBack to text: ↑1↑2↑3↑4↑5↑6↑7↑8↑9↑10
- CRS IF12007, A Visual Depiction of the Shift from DB to DC Pension Plans; December 27, 2021Official sourceBack to text: ↑1↑2↑3
- IRS Statistics of Income, 2003 Special Studies; Accumulation and Distributions of Retirement Assets, 1996–2000Official source · PDFBack to text: ↑
- CRS R48091, Contributions to Defined Contribution Retirement Plans; statutory history and footnote 11Official sourceBack to text: ↑
- IRS, 401(k) plan overviewOfficial sourceBack to text: ↑
- Federal Reserve Bank of St. Louis, Enhancing Future Retirement Income through 401(k)s; October 1, 1998SourceBack to text: ↑
- Investment Company Institute, 2025 Investment Company Fact Book, Figure 8.5; industry estimatesSource · PDFBack to text: ↑
- BLS National Compensation Survey, Table 1, retirement benefits; March 2026, published September 25, 2026Official releaseBack to text: ↑1↑2
- CRS IF12756, Defined Contribution Retirement Plans: Automatic Enrollment; September 5, 2024Official sourceBack to text: ↑1↑2
- IRS Internal Revenue Bulletin 2025-08; proposed automatic-enrollment regulations and enacted section 414A requirementsOfficial sourceBack to text: ↑1↑2
- IRS, Long-Term Part-Time Employees in 401(k) Plans; January 2024 guidanceSourceBack to text: ↑
- DOL/EBSA, Understanding Retirement Plan Fees and ExpensesOfficial sourceBack to text: ↑1↑2
- Federal Reserve, Changes in U.S. Family Finances from 2019 to 2022; October 2023, Table 3Official sourceBack to text: ↑